import warnings
warnings.filterwarnings('ignore')

import numpy as np
np.random.seed(12345)
import matplotlib.pyplot as plt
plt.rc("figure", figsize=(10, 6))
np.set_printoptions(precision=4, suppress=True)
import matplotlib.pyplot as plt
# Matplotlib 한글 폰트 설정 (macOS용)
plt.rc('font', family='AppleGothic')
plt.rc('axes', unicode_minus=False)3 4장: NumPy 기본: 배열과 벡터 연산
수치 데이터를 다루는 가장 중요한 라이브러리인 NumPy를 학습합니다.
3.1 NumPy의 효율성
파이썬 리스트와 NumPy 배열의 성능 차이를 비교해 봅니다.
import numpy as np

my_arr = np.arange(1_000_000)
my_list = list(range(1_000_000))%timeit my_arr2 = my_arr * 2
%timeit my_list2 = [x * 2 for x in my_list]571 μs ± 11.1 μs per loop (mean ± std. dev. of 7 runs, 1,000 loops each)
14.3 ms ± 199 μs per loop (mean ± std. dev. of 7 runs, 100 loops each)3.2 ndarray 생성
리스트나 다른 시퀀스 데이터를 np.array를 사용하여 배열로 변환하는 방법을 알아봅니다.
3.3 ndarray 객체
NumPy의 핵심인 다차원 배열 객체의 특성을 이해합니다.
import numpy as np
data = np.array([[1.5, -0.1, 3], [0, -3, 6.5]])
data
array([[ 1.5, -0.1, 3. ],
[ 0. , -3. , 6.5]])data * 10
data + dataarray([[ 3. , -0.2, 6. ],
[ 0. , -6. , 13. ]])data.shape
data.dtypedtype('float64')data1 = [6, 7.5, 8, 0, 1]
arr1 = np.array(data1)
arr1array([6. , 7.5, 8. , 0. , 1. ])data2 = [[1, 2, 3, 4], [5, 6, 7, 8]]
arr2 = np.array(data2)
arr2array([[1, 2, 3, 4],
[5, 6, 7, 8]])arr2.ndim
arr2.shape(2, 4)arr1.dtype
arr2.dtypedtype('int64')np.zeros(10)
np.zeros((3, 6))
np.empty((2, 3, 2))array([[[0., 0.],
[0., 0.],
[0., 0.]],
[[0., 0.],
[0., 0.],
[0., 0.]]])np.arange(15)array([ 0, 1, 2, 3, 4, 5, 6, 7, 8, 9, 10, 11, 12, 13, 14])3.4 데이터 타입 (dtype)
배열이 담고 있는 데이터의 종류를 확인하고 변환하는 방법을 살펴봅니다.
arr1 = np.array([1, 2, 3], dtype=np.float64)
arr2 = np.array([1, 2, 3], dtype=np.int32)
arr1.dtype
arr2.dtypedtype('int32')arr = np.array([1, 2, 3, 4, 5])
arr.dtype
float_arr = arr.astype(np.float64)
float_arr
float_arr.dtypedtype('float64')arr = np.array([3.7, -1.2, -2.6, 0.5, 12.9, 10.1])
arr
arr.astype(np.int32)array([ 3, -1, -2, 0, 12, 10], dtype=int32)numeric_strings = np.array(["1.25", "-9.6", "42"], dtype=np.string_)
numeric_strings.astype(float)array([ 1.25, -9.6 , 42. ])int_array = np.arange(10)
calibers = np.array([.22, .270, .357, .380, .44, .50], dtype=np.float64)
int_array.astype(calibers.dtype)array([0., 1., 2., 3., 4., 5., 6., 7., 8., 9.])zeros_uint32 = np.zeros(8, dtype="u4")
zeros_uint32array([0, 0, 0, 0, 0, 0, 0, 0], dtype=uint32)3.5 산술 연산
배열 간의 산술 연산과 브로드캐스팅의 기초를 알아봅니다.
arr = np.array([[1., 2., 3.], [4., 5., 6.]])
arr
arr * arr
arr - arr
array([[0., 0., 0.],
[0., 0., 0.]])1 / arr
arr ** 2array([[ 1., 4., 9.],
[16., 25., 36.]])arr2 = np.array([[0., 4., 1.], [7., 2., 12.]])
arr2
arr2 > arrarray([[False, True, False],
[ True, False, True]])3.6 색인과 슬라이싱
배열의 특정 데이터에 접근하고 부분 집합을 선택하는 방법을 다룹니다.
3.7 색인과 슬라이싱
배열의 특정 부분에 접근하고 데이터를 수정하는 방법을 익힙니다.
arr = np.arange(10)
arr
arr[5]
arr[5:8]
arr[5:8] = 12
arr
array([ 0, 1, 2, 3, 4, 12, 12, 12, 8, 9])arr_slice = arr[5:8]
arr_slicearray([12, 12, 12])arr_slice[1] = 12345
arrarray([ 0, 1, 2, 3, 4, 12, 12345, 12, 8,
9])arr_slice[:] = 64
arrarray([ 0, 1, 2, 3, 4, 64, 64, 64, 8, 9])arr2d = np.array([[1, 2, 3], [4, 5, 6], [7, 8, 9]])
arr2d[2]array([7, 8, 9])arr2d[0][2]
arr2d[0, 2]3arr3d = np.array([[[1, 2, 3], [4, 5, 6]], [[7, 8, 9], [10, 11, 12]]])
arr3darray([[[ 1, 2, 3],
[ 4, 5, 6]],
[[ 7, 8, 9],
[10, 11, 12]]])arr3d[0]array([[1, 2, 3],
[4, 5, 6]])old_values = arr3d[0].copy()
arr3d[0] = 42
arr3d
arr3d[0] = old_values
arr3darray([[[ 1, 2, 3],
[ 4, 5, 6]],
[[ 7, 8, 9],
[10, 11, 12]]])arr3d[1, 0]array([7, 8, 9])x = arr3d[1]
x
x[0]array([7, 8, 9])arr
arr[1:6]array([ 1, 2, 3, 4, 64])arr2d
arr2d[:2]array([[1, 2, 3],
[4, 5, 6]])arr2d[:2, 1:]array([[2, 3],
[5, 6]])lower_dim_slice = arr2d[1, :2]lower_dim_slice.shape(2,)arr2d[:2, 2]array([3, 6])arr2d[:, :1]array([[1],
[4],
[7]])arr2d[:2, 1:] = 0
arr2darray([[1, 0, 0],
[4, 0, 0],
[7, 8, 9]])3.8 불리언 색인
조건식을 활용하여 배열 내 특정 데이터를 선택하는 강력한 기능을 학습합니다.
names = np.array(["Bob", "Joe", "Will", "Bob", "Will", "Joe", "Joe"])
data = np.array([[4, 7], [0, 2], [-5, 6], [0, 0], [1, 2],
                 [-12, -4], [3, 4]])
names
data
array([[ 4, 7],
[ 0, 2],
[ -5, 6],
[ 0, 0],
[ 1, 2],
[-12, -4],
[ 3, 4]])names == "Bob"array([ True, False, False, True, False, False, False])data[names == "Bob"]array([[4, 7],
[0, 0]])data[names == "Bob", 1:]
data[names == "Bob", 1]array([7, 0])names != "Bob"
~(names == "Bob")
data[~(names == "Bob")]array([[ 0, 2],
[ -5, 6],
[ 1, 2],
[-12, -4],
[ 3, 4]])cond = names == "Bob"
data[~cond]array([[ 0, 2],
[ -5, 6],
[ 1, 2],
[-12, -4],
[ 3, 4]])mask = (names == "Bob") | (names == "Will")
mask
data[mask]array([[ 4, 7],
[-5, 6],
[ 0, 0],
[ 1, 2]])data[data < 0] = 0
dataarray([[4, 7],
[0, 2],
[0, 6],
[0, 0],
[1, 2],
[0, 0],
[3, 4]])data[names != "Joe"] = 7
dataarray([[7, 7],
[0, 2],
[7, 7],
[7, 7],
[7, 7],
[0, 0],
[3, 4]])arr = np.zeros((8, 4))
for i in range(8):
arr[i] = i
arrarray([[0., 0., 0., 0.],
[1., 1., 1., 1.],
[2., 2., 2., 2.],
[3., 3., 3., 3.],
[4., 4., 4., 4.],
[5., 5., 5., 5.],
[6., 6., 6., 6.],
[7., 7., 7., 7.]])arr[[4, 3, 0, 6]]array([[4., 4., 4., 4.],
[3., 3., 3., 3.],
[0., 0., 0., 0.],
[6., 6., 6., 6.]])arr[[-3, -5, -7]]array([[5., 5., 5., 5.],
[3., 3., 3., 3.],
[1., 1., 1., 1.]])arr = np.arange(32).reshape((8, 4))
arr
arr[[1, 5, 7, 2], [0, 3, 1, 2]]array([ 4, 23, 29, 10])arr[[1, 5, 7, 2]][:, [0, 3, 1, 2]]array([[ 4, 7, 5, 6],
[20, 23, 21, 22],
[28, 31, 29, 30],
[ 8, 11, 9, 10]])arr[[1, 5, 7, 2], [0, 3, 1, 2]]
arr[[1, 5, 7, 2], [0, 3, 1, 2]] = 0
arrarray([[ 0, 1, 2, 3],
[ 0, 5, 6, 7],
[ 8, 9, 0, 11],
[12, 13, 14, 15],
[16, 17, 18, 19],
[20, 21, 22, 0],
[24, 25, 26, 27],
[28, 0, 30, 31]])3.9 배열 전치와 축 바꾸기
데이터의 모양을 변경하거나 축을 전환하는 기법을 배웁니다.
arr = np.arange(15).reshape((3, 5))
arr
arr.T
array([[ 0, 5, 10],
[ 1, 6, 11],
[ 2, 7, 12],
[ 3, 8, 13],
[ 4, 9, 14]])arr = np.array([[0, 1, 0], [1, 2, -2], [6, 3, 2], [-1, 0, -1], [1, 0, 1]])
arr
np.dot(arr.T, arr)array([[39, 20, 12],
[20, 14, 2],
[12, 2, 10]])arr.T @ arrarray([[39, 20, 12],
[20, 14, 2],
[12, 2, 10]])arr
arr.swapaxes(0, 1)array([[ 0, 1, 6, -1, 1],
[ 1, 2, 3, 0, 0],
[ 0, -2, 2, -1, 1]])samples = np.random.standard_normal(size=(4, 4))
samplesarray([[-0.2047, 0.4789, -0.5194, -0.5557],
[ 1.9658, 1.3934, 0.0929, 0.2817],
[ 0.769 , 1.2464, 1.0072, -1.2962],
[ 0.275 , 0.2289, 1.3529, 0.8864]])from random import normalvariate
N = 1_000_000
%timeit samples = [normalvariate(0, 1) for _ in range(N)]
%timeit np.random.standard_normal(N)224 ms ± 1.03 ms per loop (mean ± std. dev. of 7 runs, 1 loop each)
9.51 ms ± 35.1 μs per loop (mean ± std. dev. of 7 runs, 100 loops each)rng = np.random.default_rng(seed=12345)
data = rng.standard_normal((2, 3))type(rng)numpy.random._generator.Generatorarr = np.arange(10)
arr
np.sqrt(arr)
np.exp(arr)array([ 1. , 2.7183, 7.3891, 20.0855, 54.5982, 148.4132,
403.4288, 1096.6332, 2980.958 , 8103.0839])x = rng.standard_normal(8)
y = rng.standard_normal(8)
x
y
np.maximum(x, y)array([-0.467 , 0.6489, 0.7888, -1.2567, 2.3474, 1.399 , 1.3223,
0.9022])arr = rng.standard_normal(7) * 5
arr
remainder, whole_part = np.modf(arr)
remainder
whole_partarray([ 4., -8., -0., 2., -6., -0., 8.])arr
out = np.zeros_like(arr)
np.add(arr, 1)
np.add(arr, 1, out=out)
outarray([ 5.5146, -7.1079, 0.2091, 3.2474, -5.718 , 0.5916, 9.6237])points = np.arange(-5, 5, 0.01) # 100 equally spaced points
xs, ys = np.meshgrid(points, points)
ysarray([[-5. , -5. , -5. , ..., -5. , -5. , -5. ],
[-4.99, -4.99, -4.99, ..., -4.99, -4.99, -4.99],
[-4.98, -4.98, -4.98, ..., -4.98, -4.98, -4.98],
...,
[ 4.97, 4.97, 4.97, ..., 4.97, 4.97, 4.97],
[ 4.98, 4.98, 4.98, ..., 4.98, 4.98, 4.98],
[ 4.99, 4.99, 4.99, ..., 4.99, 4.99, 4.99]])z = np.sqrt(xs ** 2 + ys ** 2)
zarray([[7.0711, 7.064 , 7.0569, ..., 7.0499, 7.0569, 7.064 ],
[7.064 , 7.0569, 7.0499, ..., 7.0428, 7.0499, 7.0569],
[7.0569, 7.0499, 7.0428, ..., 7.0357, 7.0428, 7.0499],
...,
[7.0499, 7.0428, 7.0357, ..., 7.0286, 7.0357, 7.0428],
[7.0569, 7.0499, 7.0428, ..., 7.0357, 7.0428, 7.0499],
[7.064 , 7.0569, 7.0499, ..., 7.0428, 7.0499, 7.0569]])import matplotlib.pyplot as plt
plt.imshow(z, cmap=plt.cm.gray, extent=[-5, 5, -5, 5])
plt.colorbar()
plt.title("Image plot of $\sqrt{x^2 + y^2}$ for a grid of values")Text(0.5, 1.0, 'Image plot of $\\sqrt{x^2 + y^2}$ for a grid of values')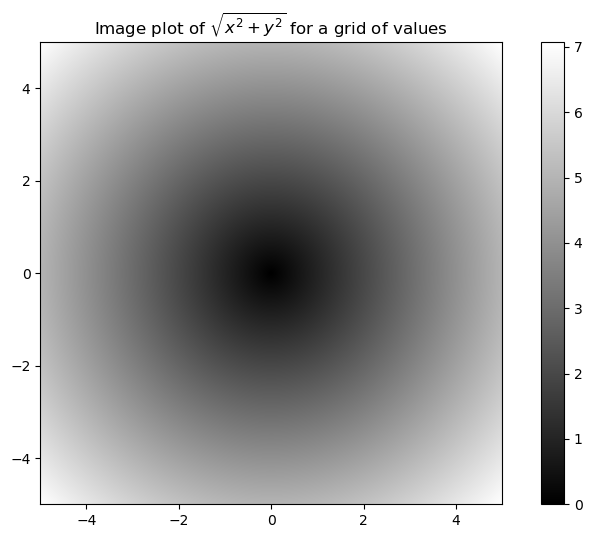
plt.draw()<Figure size 1000x600 with 0 Axes>plt.close("all")xarr = np.array([1.1, 1.2, 1.3, 1.4, 1.5])
yarr = np.array([2.1, 2.2, 2.3, 2.4, 2.5])
cond = np.array([True, False, True, True, False])result = [(x if c else y)
for x, y, c in zip(xarr, yarr, cond)]
result[1.1, 2.2, 1.3, 1.4, 2.5]result = np.where(cond, xarr, yarr)
resultarray([1.1, 2.2, 1.3, 1.4, 2.5])arr = rng.standard_normal((4, 4))
arr
arr > 0
np.where(arr > 0, 2, -2)array([[ 2, 2, 2, -2],
[-2, -2, 2, 2],
[-2, -2, 2, 2],
[-2, 2, -2, -2]])np.where(arr > 0, 2, arr) # set only positive values to 2array([[ 2. , 2. , 2. , -0.959 ],
[-1.2094, -1.4123, 2. , 2. ],
[-0.6588, -1.2287, 2. , 2. ],
[-0.1308, 2. , -0.093 , -0.0662]])arr = rng.standard_normal((5, 4))
arr
arr.mean()
np.mean(arr)
arr.sum()-1.743948891486906arr.mean(axis=1)
arr.sum(axis=0)array([-1.6292, 1.0399, -0.3344, -0.8203])arr = np.array([0, 1, 2, 3, 4, 5, 6, 7])
arr.cumsum()array([ 0, 1, 3, 6, 10, 15, 21, 28])arr = np.array([[0, 1, 2], [3, 4, 5], [6, 7, 8]])
arrarray([[0, 1, 2],
[3, 4, 5],
[6, 7, 8]])arr.cumsum(axis=0)
arr.cumsum(axis=1)array([[ 0, 1, 3],
[ 3, 7, 12],
[ 6, 13, 21]])arr = rng.standard_normal(100)
(arr > 0).sum() # Number of positive values
(arr <= 0).sum() # Number of non-positive values52bools = np.array([False, False, True, False])
bools.any()
bools.all()Falsearr = rng.standard_normal(6)
arr
arr.sort()
arrarray([-0.7208, -0.6839, -0.0824, -0.0548, 0.0773, 1.1206])arr = rng.standard_normal((5, 3))
arrarray([[ 0.936 , 1.2385, 1.2728],
[ 0.4059, -0.0503, 0.2893],
[ 0.1793, 1.3975, 0.292 ],
[ 0.6384, -0.0279, 1.3711],
[-2.0528, 0.3805, 0.7554]])arr.sort(axis=0)
arr
arr.sort(axis=1)
arrarray([[-2.0528, -0.0503, 0.2893],
[-0.0279, 0.1793, 0.292 ],
[ 0.3805, 0.4059, 0.7554],
[ 0.6384, 1.2385, 1.2728],
[ 0.936 , 1.3711, 1.3975]])arr2 = np.array([5, -10, 7, 1, 0, -3])
sorted_arr2 = np.sort(arr2)
sorted_arr2array([-10, -3, 0, 1, 5, 7])names = np.array(["Bob", "Will", "Joe", "Bob", "Will", "Joe", "Joe"])
np.unique(names)
ints = np.array([3, 3, 3, 2, 2, 1, 1, 4, 4])
np.unique(ints)array([1, 2, 3, 4])sorted(set(names))['Bob', 'Joe', 'Will']values = np.array([6, 0, 0, 3, 2, 5, 6])
np.in1d(values, [2, 3, 6])array([ True, False, False, True, True, False, True])arr = np.arange(10)
np.save("some_array", arr)np.load("some_array.npy")array([0, 1, 2, 3, 4, 5, 6, 7, 8, 9])np.savez("array_archive.npz", a=arr, b=arr)arch = np.load("array_archive.npz")
arch["b"]array([0, 1, 2, 3, 4, 5, 6, 7, 8, 9])np.savez_compressed("arrays_compressed.npz", a=arr, b=arr)!rm some_array.npy
!rm array_archive.npz
!rm arrays_compressed.npzx = np.array([[1., 2., 3.], [4., 5., 6.]])
y = np.array([[6., 23.], [-1, 7], [8, 9]])
x
y
x.dot(y)array([[ 28., 64.],
[ 67., 181.]])np.dot(x, y)array([[ 28., 64.],
[ 67., 181.]])x @ np.ones(3)array([ 6., 15.])from numpy.linalg import inv, qr
X = rng.standard_normal((5, 5))
mat = X.T @ X
inv(mat)
mat @ inv(mat)array([[ 1., -0., -0., 0., 0.],
[-0., 1., 0., -0., -0.],
[ 0., 0., 1., -0., 0.],
[ 0., 0., 0., 1., 0.],
[-0., 0., -0., 0., 1.]])import random
position = 0
walk = [position]
nsteps = 1000
for _ in range(nsteps):
step = 1 if random.randint(0, 1) else -1
position += step
walk.append(position)plt.figure()<Figure size 1000x600 with 0 Axes><Figure size 1000x600 with 0 Axes>plt.plot(walk[:100])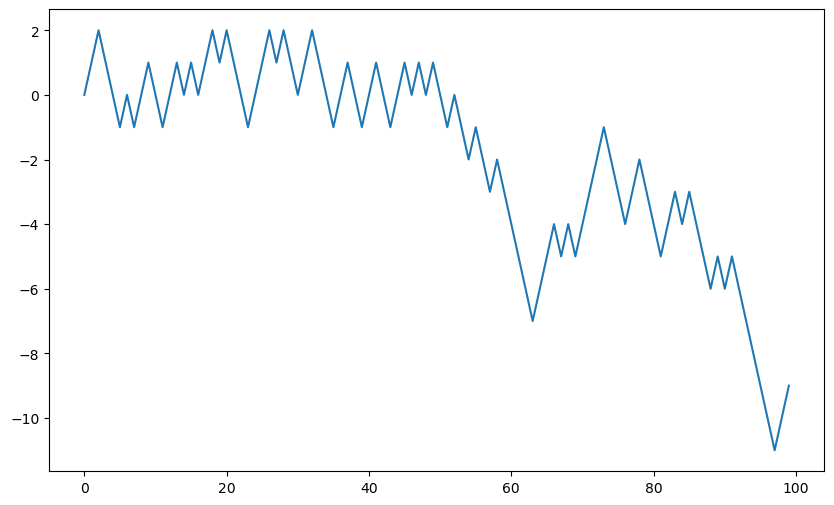
nsteps = 1000
rng = np.random.default_rng(seed=12345)  # fresh random generator
draws = rng.integers(0, 2, size=nsteps)
steps = np.where(draws == 0, 1, -1)
walk = steps.cumsum()walk.min()
walk.max()50(np.abs(walk) >= 10).argmax()155nwalks = 5000
nsteps = 1000
draws = rng.integers(0, 2, size=(nwalks, nsteps)) # 0 or 1
steps = np.where(draws > 0, 1, -1)
walks = steps.cumsum(axis=1)
walksarray([[ 1, 2, 3, ..., 22, 23, 22],
[ 1, 0, -1, ..., -50, -49, -48],
[ 1, 2, 3, ..., 50, 49, 48],
...,
[ -1, -2, -1, ..., -10, -9, -10],
[ -1, -2, -3, ..., 8, 9, 8],
[ -1, 0, 1, ..., -4, -3, -2]])walks.max()
walks.min()-120hits30 = (np.abs(walks) >= 30).any(axis=1)
hits30
hits30.sum() # Number that hit 30 or -303395crossing_times = (np.abs(walks[hits30]) >= 30).argmax(axis=1)
crossing_timesarray([201, 491, 283, ..., 219, 259, 541])crossing_times.mean()500.5699558173785draws = 0.25 * rng.standard_normal((nwalks, nsteps))